6.5 Image Enhancement in Multispectral Space - Multispectral Transformation
6.5 Image Enhancement in Multispectral Space - Multispectral Transformation
The multispectral or vector nature of most remote sensing data makes it possible for spectral transformations to generate new sets of image components or bands. The transformed image may make evident features not discernable in the original data or alternatively, it might possibly preserve the essential information content of the image with a reduced number of the transformed dimensions. The last point has significance for the display of a data in three dimensions on a colour monitor or in colour hardcopy, and for transmission and storage of data.
6.5.1 Image arithmetic, band ratios and vegetation indices
Addition, subtraction, multiplication, and division of the pixel brightnesses from two bands of image data form a new image. Multiplication is not as useful as others.
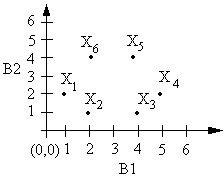
We can plot the pixel values in a two-dimensional space (Figure 6.10.) This two-dimensional diagram is called a scatter plot.
A multispectral space is a coordinating system in which each axis represents the grey-level values of a specific image band.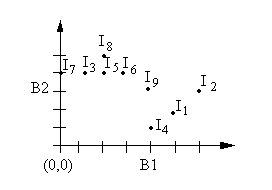
Figure 6.10. A scatterplot
RatioRatioing also allows for shade effect suppression.
R(i,j) is the ratio for pixel coordinate (i,j)
ak, bk are constants, there are at least one a and one b that are not 0.
nb is the number of bands.
Commonly used ratios are:

Rv - a ratio that tends to enhance vegetation. It is also called a vegetation index.
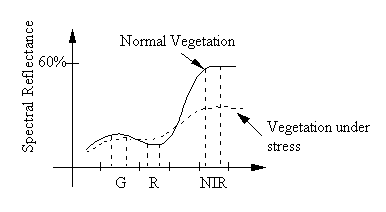
Figure 6.11 shows that for a healthy vegetation, the spectral reflectance difference between the NIR band and the R band is quite high. As the vegetation suffers from stress, the difference is smaller.Figure 6.11. Reflectances of two types of vegetation
To generate two ratios between SRNIR and SRR, one for the normal vegetation and one for the vegetation which is under stress, we use the following equations.
From these ratios, RVN > RVS, we can observe the difference in the conditions of the two types of vegetation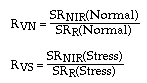
SR represents spectral reflectance.
Vegetation Indices
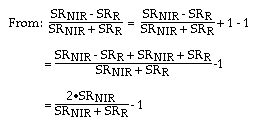
Normalized Difference Vegetation Index (NDVI)This is calculated from the raw remote sensing data. We can also calculate the NDVI using the processed remote sensing data (after converting digital numbers to spectral reflectances)
To suppress the effect of different soil backgrounds on the NDVI, Huete (1989) recommended to use a soil-adjusted vegetation index:
6.5.2 Principal component transformation
The mathematical equivalence of NDVI
Transformed Vegetation Index
TVI = {(DNNIR - DNR)/(DNNIR + DNR)}1/2
Perpendicular Vegetation Index
The dimension of the multispectral space constructed by a remotely sensed image is the number of spectral bands. For example, Landsat MSS image constructs a four dimensional multispectral space. For Landsat TM image, the multispectral space will have seven dimensions.
For simplicity purpose, two-dimensional data will be used as examples to illustrate the procedure of principal component transformation. Without loss of generality, the procedure can be applied to data in multispectral space of any dimension.
The Covariance Matrix and Correlation MatrixTwo examples will be used to illustrate the usefulness of covariance matrix.
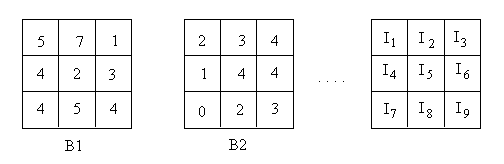
Example 1
|
|
|
|
|
|
|
|
|
|
|
|
|
|
|
|
|
|
|
|
|
|
|
|
|
|
|
|
|
|
|
|
|
|
|
|
|
|
|
|
|
|
|
|
|
|
|
|
|
Scatter plot for Example 1
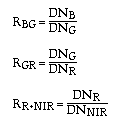
Example 2
|
|
|
|
|
|
|
|
|
|
|
|
|
|
|
|
|
|
|
|
|
|
|
|
|
|
|
|
|
|
|
|
|
|
|
|
|
|
|
To calculate the means in vector form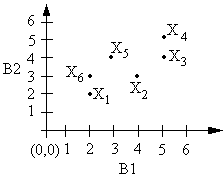
Scatter plot of example 2
For variance-covariance matrix V
where N is the number of pixels.
Since N is normally very large we can approximate and write
The covariance matrix for example one is
V is an nb x nb symmetric matrix.
The mean vectors and (Xi - M) are as listed in the two example tables.
What are the differences between V1 and V2? We can answer this question by further examining their corresponding correlation matrices R1 and R2.
From R1, we can see that the correlation between Band 1 and 2 is 0. This means that Band 1 and Band 2 contain independent information about our target. We cannot use B1 to replace B2.
For R2, the correlation between Band
1 and Band 2 is 0.761, which is quite high. Using either channel, we can
obtain, to a large extent, information about the other channel.
The Principal Component Transformation (PCT)
PCT, or an Hoteling transformation, is the purpose of a principal component transformation to find a new set of coordinate system in which data can be represented without correlation as for the case of V1. In other words, can we find a coordinating system such that V2 can be transformed to a diagonal matrix? The answer can be found in matrix algebra.
X ----------->YIt is recommended that a rotation matrix be used to complete this process. The rotation matrix is G,transformation
Y = GX .G can be found by deriving the eigenvalues and eigenvectors from the covariance matrix Vx. To find eigenvalues we need to solve
| Vx -Where "I" is an identity matrix.lI | = 0 (1)
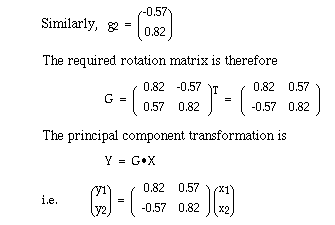
For each non-zero eigenvalue, li, we can find its corresponding eigenvector gi = (gi1, gi2, ...., ginb)T . This can be obtained from
[ Vx -The rotation matrix G can then be determined by
![]()
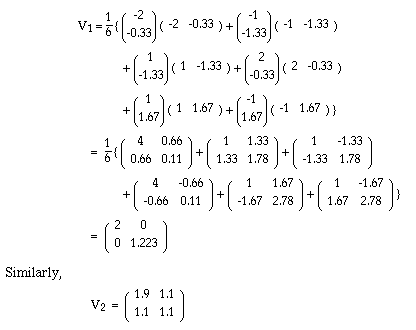
As an example, we will find the eigenvalues and eigenvectors for V2 =
To find eigenvalues, we use (1)

Once the transformation is done, the covariance matrix is in the new coordinating system
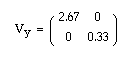
Now the results can be interpreted using the data in example 2 (Figure 6.12).
B'1 and B'2 are the new axes. In this coordinating system, data variance along B'1 is 2.67 while variance on B'2 is only 0.33. This means that in the rotated space, the data variance along one axis is the same as its corresponding eigenvalue.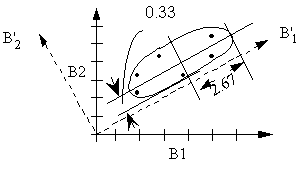
Figure 6.12. The new axes derived from the PCT in the original coordinate system.
From, 2.67 + 0.33 = 1.90 + 1.10 = 3.00, we can see that the rotation will not affect the total variance of the original data. Using 1.90/3.00 and 1.10/3.00 we can determine the percentage of total variances that B1 and B2 represent.
B1 represents 1.90/3.00 = 63.3% of the total variance of the original dataThe percentages are called loading of each band.B2 represents 1.10/3.00 = 36.7% of the total variance of the original data
For B'1, it represents 2.67/3.00 = 89% of the total variance while B'2 contains only 11% of the total variance.
From the loadings of B'1 and B'2, we can see that after the rotation we can add more loading in one band while reducing the amount of loading in another band. For multispectral space with nb dimensions, after the principal component transformation, we will have a few higher loadings for the first few bands and a very low loading for the rest. We call those bands containing relatively high loadings the principal components. We can, therefore, make the use of these principal components in our data analysis while ignoring those relatively minor components. By so doing, we will not lose much of the original data variability. This serves as a purpose of reducing data dimensionality. It's application in classification (keeping the maximum variance) and in change detection (keeping the minimal variance) normally holds the promise.
The PCT is a linear transformation technique which helps to enhance remotely sensed imagery. Although, principal components are often used, minor components may also be useful in highlighting information on low data variability that the remote sensing data have. For example, a few researchers have used the PCT to multi-temporal change detection. They found that changes in information of a scene are preserved in minor components.
6.5.3 Tasselled Cap Transform (K-T transform)
Different from the PCT which is based on the data covariance matrix, Kauth and Thomas (1976) have developed a linear transformation which is physically-based on crop growth.
The growing cycle of crop started from bare soil, then to green vegetation and then to crop maturation with crops turning yellow. These different stages of vegetation growth has made the data distribution in the three dimensional multispectral space (Figure 6.13) appear in a shape of a tasselled cap.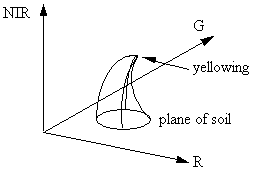
Figure 6.13. A 3-D data scatterplot of the multispectral space constructed by the green, red and near-infrared bands (Which looks like a tasselled cap.)
Kauth and Thomas defined a linear transformation to enhance the data according to the data structure. They have defined four components called, redness (soil), greenness (vegetation), yellowness and noise, using the following transformation matrix for Landsat MSS data
Later, Crist, Cicone and Kauth developed a new transformation technique for Landsat TM data. (Crist and Kauth, 1986; Crist and Cicone, 1984)
Their new redness or brightness and greenness are defined as:
Redness = 0.3037 TM1 + 0.2793 TM2 + 0.4743 TM3+ 0.5586 TM4 + 0.5082 TM5 + 0.1863 TM7
Greenness = -0.2848 TM1 - 0.2435 TM2 - 0.5436 TM3
+ 0.7243 TM4 + 0.0840 TM5 - 0.1800 TM7 .