SOD Blitz 2018 Results
| Location | Surveyed Trees | Symptomatic Oak Nearby? % | Sampled Trees | SOD Positive Sampled Trees % | Estimated True Infection Rate % | Symptomatic Surveyed Trees % |
|---|---|---|---|---|---|---|
| Big Sur | 87 | 38.1 | 21 | 4.8 | 3.8 | 80.5 |
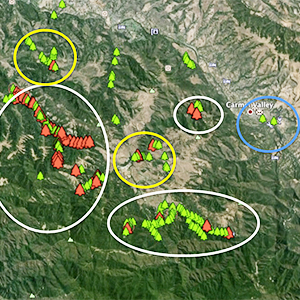
| Carmel | 985 | 3.7 | 215 | 2.3 | 1.1 | 48.2 |
| East Bay-East | 56 | 12.5 | 48 | 22.9 | 12.7 | 55.4 |
| East Bay-South | 54 | 0.0 | 4 | 0.0 | 0.0 | 7.4 |
| East Bay-West | 584 | 6.2 | 97 | 6.2 | 1.1 | 18.2 |
| Marin | 1073 | 22.9 | 144 | 9.0 | 2.5 | 28.1 |
| Mendocino | 592 | 12.3 | 73 | 6.8 | 1.4 | 20.1 |
| Napa | 53 | 0.0 | 40 | 2.5 | 1.5 | 60.4 |
| Peninsula-East | 816 | 17.9 | 162 | 10.5 | 6.0 | 57.0 |
| Peninsula-North | 177 | 7.4 | 27 | 3.7 | 1.0 | 26.0 |
| Peninsula-South | 300 | 17.0 | 88 | 42.0 | 19.1 | 45.3 |
| Peninsula-West | 3558 | 20.7 | 439 | 31.4 | 6.1 | 19.4 |
| San Francisco | 2982 | 0.0 | 198 | 0.0 | 0.0 | 9.9 |
| San Luis Obisbo | 699 | 3.6 | 139 | 0.0 | 0.0 | 18.7 |
| Santa Cruz | 324 | 3.0 | 66 | 6.1 | 3.6 | 59.6 |
| Sonoma-East | 390 | 17.9 | 78 | 21.8 | 9.7 | 44.4 |
| Sonoma-North | 124 | 18.9 | 37 | 5.4 | 1.8 | 33.9 |
| Sonoma-West | 532 | 10.8 | 102 | 10.8 | 2.9 | 26.5 |
| Trinity-Humboldt-Siskiyou | 118 | 0.0 | 34 | 0.0 | 0.0 | 19.5 |
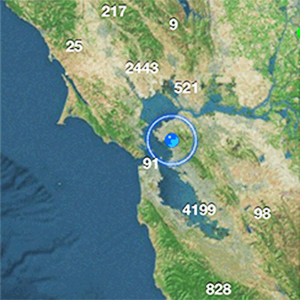
| Total= | 13504 | 12.2 | 2012 | 9.8 | 3.5 | 35.7 |
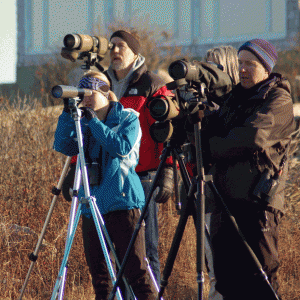
Total number of 2018 SOD Blitz collectors = 304
SOD Blitz Community Meetings and Workshops Schedule
Back to SOD Blitz landing page
This activity possible thanks to funding from:
USDA Forest Service, State and Private Forestry
PG&E Foundation
National Science Foundation

