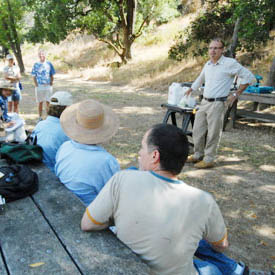
SOD Blitz 2021 – Results Meeting Webinar Recording
Need Google Earth? Download and install Google Earth here
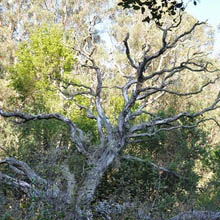
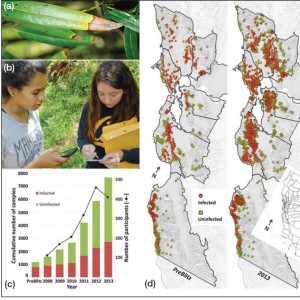
Summary of 2021 SODBlitz Results4-2
SOD Blitz 2021 Results Table
| Location | Surveyed Trees | Syptomatic Oaks Nearby? % | Sampled Trees | SOD Positive Sampled Trees % | Estimated True Infection Rate % | Symptomatic Surveyed Trees % |
|---|---|---|---|---|---|---|
| Big Sur | 292 | 0 | 43 | 46.5 | 5.9 | 12.7 |
| Carmel | 1858 | 9.4 | 245 | 8.2 | 5.1 | 62.7 |
| Del Norte | 303 | 0 | 15 | 13.3 | 0.1 | 1.0 |
| East Bay East | 321 | 8.9 | 135 | 8.9 | 4.2 | 47.4 |
| East Bay South | 11 | 0 | 11 | 0 | 0 | 0 |
| East Bay West | 603 | 16.8 | 202 | 11.4 | 8.4 | 73.8 |
| Humboldt | 615 | 2 | 50 | 0 | 0 | 9.6 |
| Lake | ||||||
| Marin | 777 | 4.5 | 112 | 21.4 | 3.4 | 16.0 |
| Mendocino | 238 | 29.2 | 72 | 16.7 | 3.8 | 22.7 |
| Napa | 135 | 0 | 67 | 0 | 0 | 53.3 |
| Peninsula East | 327 | 1.8 | 55 | 1.8 | 0.5 | 26.9 |
| Peninsula North | 50 | 0 | 15 | 0 | 0 | 24.0 |
| Peninsula South | ||||||
| Peninsula West | 5718 | 16.6 | 458 | 20.3 | 4.2 | 20.6 |
| San Fancisco | 805 | 0 | 99 | 0 | 0 | 17.8 |
| San Luis Obispo | 733 | 0 | 139 | 0 | 0 | 17.7 |
| Santa Cruz | 405 | 2.2 | 46 | 8.7 | 0.9 | 10.1 |
| Siskiyou | 200 | 31.3 | 32 | 0 | 0 | 0 |
| Sonoma East | 778 | 14.5 | 159 | 20.8 | 18.6 | 89.5 |
| Sonoma North | 283 | 16.3 | 43 | 6.9 | 5.6 | 79.9 |
| Sonoma West | 352 | 7.2 | 69 | 18.8 | 4.1 | 21.9 |
| Trinity | ||||||
| Total | 14804 | 10.6 | 2067 | 10.2 | 3.3 | 32.0 |
Total number of 2021 SOD Blitz Participants = 268
2021SODBlitzRESULTS from mmg v2
Back to SOD Blitz landing page
This activity possible thanks to funding from:
USDA Forest Service, State and Private Forestry
PG&E Foundation
National Science Foundation
MidPeninsula Regional Open Space District