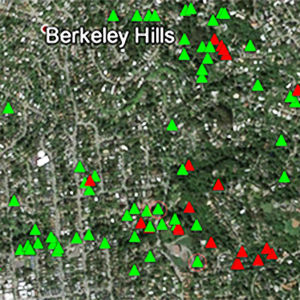
SOD Blitz Results 2013
| Location | Surveyed Trees | Symptomatic Surveyed Trees % | Sampled Trees | SOD Positive Sampled Trees % | Estimated True Infection Rate % |
|---|---|---|---|---|---|
| Big Sur | na | ||||
| Carmel | 962 | 39.5 | 195 | 17.9 | 7.1 |
| East Bay-South | 78 | 66.7 | 40 | 0.0 | 0.0 |
| East Bay-East | 582 | 33.0 | 229 | 13.5 | 4.5 |
| East Bay-West | 2007 | 31.2 | 565 | 14.5 | 4.5 |
| Marin | 983 | 65.8 | 91 | 39.6 | 26.0 |
| Mendocino | 559 | 17.0 | 72 | 6.9 | 1.2 |
| Napa | 949 | 17.3 | 66 | 6.1 | 1.0 |
| Peninsula-North | 132 | 40.2 | 52 | 23.1 | 9.3 |
| Peninsula-South | 879 | 53.7 | 173 | 55.5 | 29.8 |
| Peninsula-East | 694 | 28.5 | 219 | 3.2 | 0.9 |
| Peninsula-West | 1300 | 30.6 | 329 | 22.2 | 6.8 |
| San Francisco | 576 | 25.3 | 109 | 108 | 0.5 |
| San Luis Obisbo | 872 | 17.5 | 123 | 0.0 | 0.0 |
| Santa Cruz | 632 | 28.6 | 62 | 54.8 | 15.7 |
| Sierra | na | ||||
| Sonoma-North | 68 | 13.2 | 26 | 11.5 | 1.5 |
| Sonoma-East | 1080 | 18.9 | 177 | 26.0 | 4.9 |
| Sonoma-West | 684 | 19.4 | 44 | 13.6 | 2.7 |
| Total= | 13037 | 32.1 | 2572 | 18.3 | 5.8 |
Total number of SOD Blitz participants = 563
Link to Latest SOD Blitz Results
This activity possible thanks to funding from:
USDA Forest Service, State and Private Forestry
The Gordon and Betty Moore Foundation