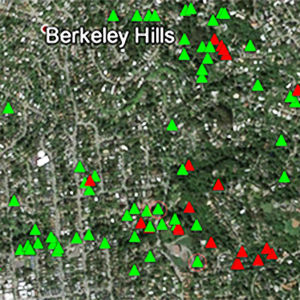
SOD Blitz 2020 Results
| Location | Surveyed Trees | Symptomatic Oak Nearby? % | Sampled Trees | SOD Positive Sampled Trees % | Estimated True Infection Rate % | Symptomatic Surveyed Trees % |
|---|---|---|---|---|---|---|
| Big Sur | 94 | 21.4 | 28 | 60.7 | 49.7 | 81.9 |
| Carmel | 754 | 5.7 | 245 | 26.1 | 9.9 | 37.9 |
| Del Norte* | 604 | 16.1 | 33 | 6.1 | 0.2 | 2.5 |
| East Bay East | 721 | 26.8 | 164 | 19.5 | 7.8 | 39.8 |
| East Bay South | 6 | 0.0 | 5 | 0.0 | 0.0 | 0.0 |
| East Bay West | 398 | 26.4 | 110 | 24.5 | 12.8 | 52.3 |
| Humboldt | 112 | 50 | 4 | 50.0 | 0.4 | 0.9 |
| Lake | 48 | 14.3 | 7 | 0.0 | 0.0 | 62.5 |
| Marin | 1097 | 15.5 | 219 | 25.1 | 9.5 | 37.6 |
| Mendocino | 596 | 17.6 | 142 | 11.3 | 6.3 | 55.5 |
| Napa | 4656 | 1.9 | 108 | 9.3 | 0.3 | 3.1 |
| Peninsula East | 214 | 16.7 | 54 | 20.4 | 11.1 | 54.7 |
| Peninsula North | 70 | 39.5 | 38 | 21.1 | 11.4 | 54.3 |
| Peninsula South | 244 | 0.0 | 22 | 4.5 | 2.5 | 54.9 |
| Peninsula West | 1878 | 15.7 | 337 | 34.1 | 13.1 | 38.5 |
| San Fancisco | 1169 | 0.0 | 49 | 0.0 | 0.0 | 50.2 |
| San Luis Obispo | 5470 | 3.8 | 130 | 0.0 | 0.0 | 2.3 |
| Santa Cruz | 487 | 17.4 | 46 | 45.7 | 14.2 | 31.2 |
| Siskiyou | 0 | 0.0 | 0 | 0.0 | 0.0 | 0.0 |
| Sonoma East | 2707 | 8.5 | 189 | 30.2 | 8.3 | 27.7 |
| Sonoma North | 128 | 3.2 | 31 | 35.5 | 5.0 | 14.1 |
| Sonoma West | 490 | 7.2 | 69 | 27.5 | 5.1 | 18.4 |
| Trinity | 0 | 0.0 | 0 | 0.0 | 0.0 | 0.0 |
| Total | 21943 | 13.5% | 2030 | 21.5% | 7.4% | 34.3% |
*Table includes two EU1 P. ramorum samples collected by UCCE outside the 2020 SOD Blitz
Total number of 2020 SOD Blitz Participants = 267
SOD Blitz Community Meetings and Workshops Schedule
Back to SOD Blitz landing page
This activity possible thanks to funding from:
USDA Forest Service, State and Private Forestry
PG&E Foundation
National Science Foundation
MidPeninsula Regional Open Space District