Noise Pollution in the United States
About the interactive map:
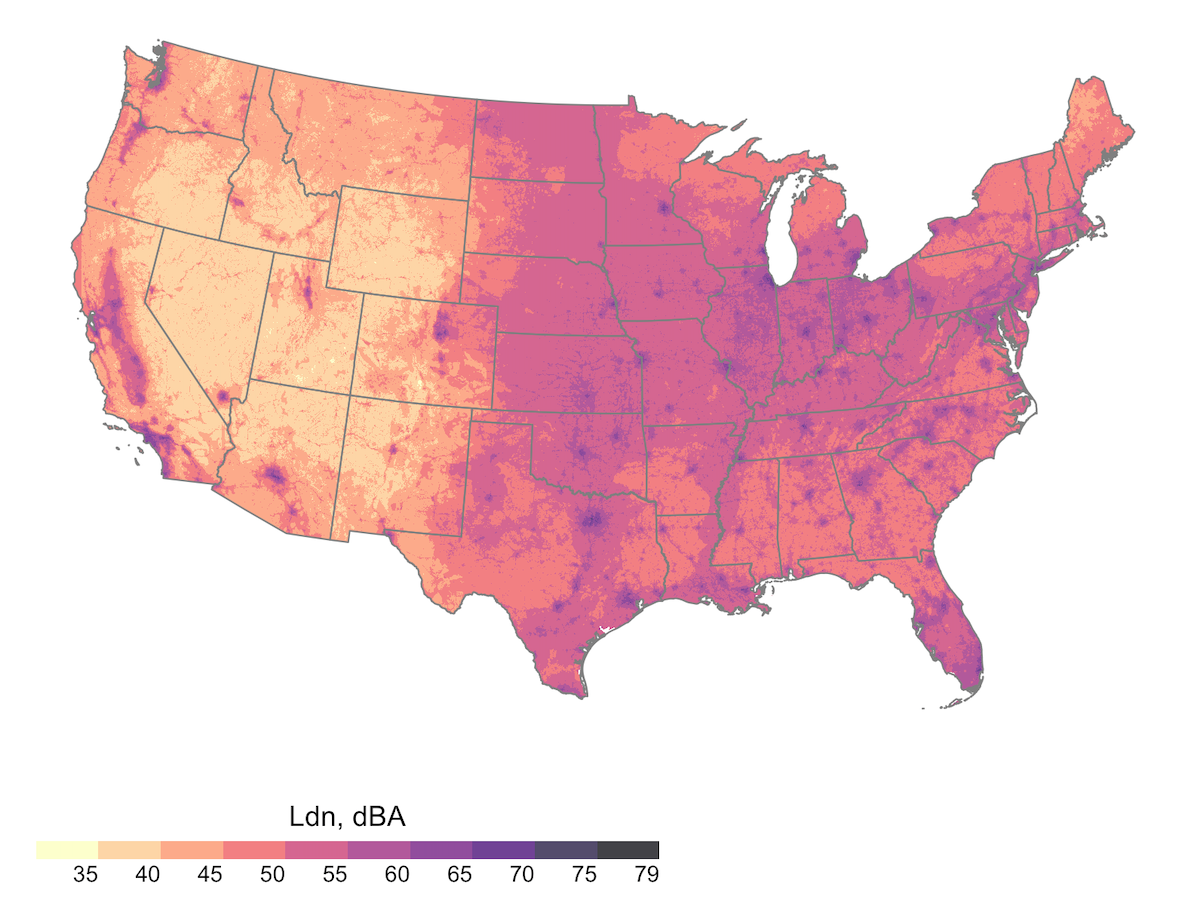
This noise map displays census tract level modeled estimates of noise, categorized as below, slightly exceeding, and exceeding the U.S. EPA day-night average sound level (Ldn) limit of <55 decibels (dB). Points (census tract centroids) display values in the small-scale map and census tract boundaries appear when the user zooms in to a specific city. Available on the large-scale (zoomed in) map, users can click a specific census tract and see which noise category the tract falls into: (1) Ldn: low = <55 dB; medium = 55-58 dB; and high = 58+ dB; and (2) Median nighttime noise: low = < 40 dB; medium = 40-43 dB; and high = 43+ dB. The noise exposure data was obtained from a geospatial model of environmental sound levels derived from empirical acoustical data and modeling of land features (topography, climate, hydrology, and anthropogenic activity) (Mennitt and Fristrup 2016). We have previously used this model in a nationwide environmental justice analysis (Casey et al. 2017). Noise exposures were estimated from a random forest model that utilizes a tree-based machine learning algorithm to combine spatial data with over 1.5 million hours of long-term noise measurements at 492 urban and rural sites in the contiguous U.S. from 2000–2014 to produce ambient sound estimates at a 270m resolution. Complete information on explanatory variables in the model are provided by the National Park Service (Sherrill 2012). The WHO recommends nighttime Leq fall below 40 dB. They describe 40 dB as the lowest observable adverse effect level for nighttime noise (WHO 2011).
Previous research:
Drs. Casey, Morello-Frosch, and colleagues identified large racial/ethnic and socioeconomic disparities in noise pollution across the United States (Casey et al. 2017). This research is based upon work supported by the Urban Institute through funds provided by the Robert Wood Johnson Foundation. We thank them for their support but acknowledge that the findings and conclusions presented in this report are those by the author(s) alone and do not necessarily reflect the opinions of the Urban Institute or the Robert Wood Johnson Foundation.
Collaborators: