UC Berkeley sits on the shores of the San Francisco Bay — one of the largest and most ecologically significant estuaries in North America. It is also a highly-invaded ecosystem that faces many threats, including water diversions, habitat modification, and pollution. As a result, the need to reverse environmental degradation and restore critical habitats has become urgent.
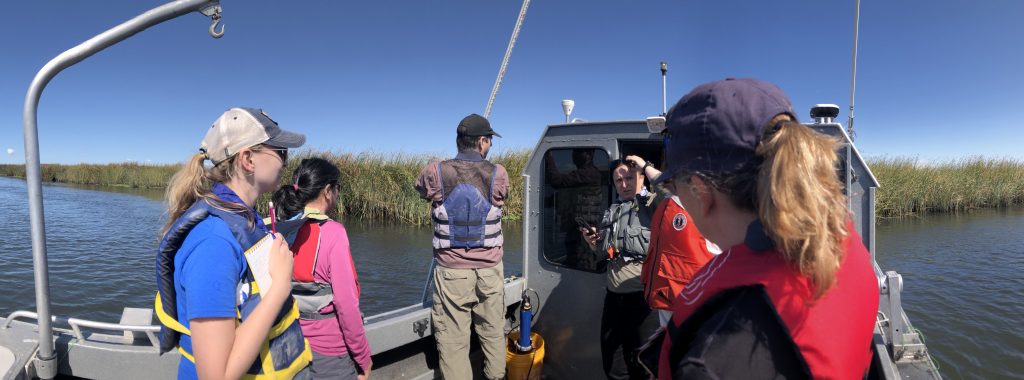
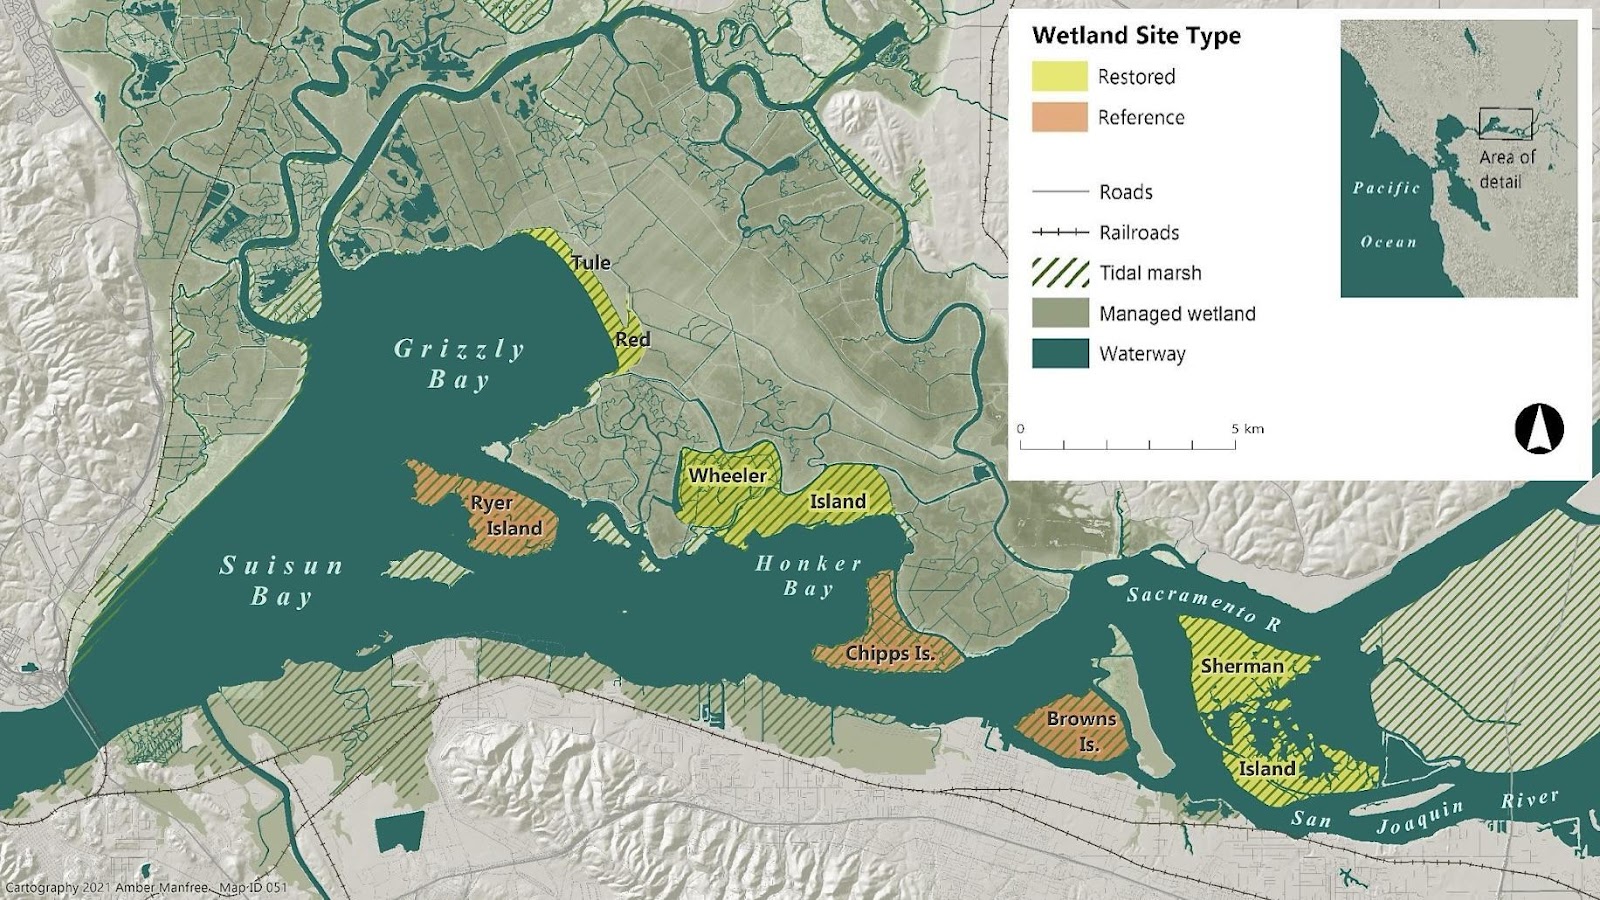
Large-scale restoration of tidal marshes and brackish wetlands in the Bay-Delta is a major example of ecological restoration across the United States. However, how whole community trajectories respond to these efforts is still poorly understood. Our group is evaluating the effects that restoration activities (e.g., breaching of freshwater ponds to reconnect them with tidal action) have on tidal marsh food webs, by tracking not only what species come back but also how they bring back biotic interactions and key energy pathways connecting basal resources to top predators.
Because estuaries are dynamic environments where rivers flow into the ocean, their salinity gradients vary significantly over time and space. These transitional habitats provide critical spawning and nursery grounds, key trophic resources, and migration corridors for many species. However, their dynamism also makes them uniquely vulnerable to climate change, as environmental shifts at both the marine and freshwater bookends can impact individual populations and disrupt interactions among them.
In a project funded by the California Dept. of Fish and Wildlife, we are examining the potential for climate change to induce phenological mismatches in the Bay-Delta–that is, ‘decoupling’ between peaks in zooplankton production and the timing of migration, spawning, and growth of juvenile forage fishes. While phenological shifts are widely reported in the climate change ecology literature, mismatches across trophic levels may be a profound, yet largely overlooked, emerging threat of climate change. Our group is leading data-driven research to identify and categorize phenological shifts in major U.S. estuaries (including the San Francisco estuary), and to identify key periods when populations might experience high mismatch risk. Future work will further test mechanisms driving phenological shifts, as well as the limits of organisms to shift their phenology in response to changing hydroclimates.


Related grants
2021-25 Lead PI (co-PI: Carlson), California Department of Fish and Wildlife Prop. 1 Awards. Will climate change disrupt pelagic food webs via phenological mismatches? Assessing past evidence and future potential in the San Francisco Bay-Delta.
2022-24 Sole PI, 2022 Delta Science / California Sea Grant Award. Restoring tidal marsh food-webs: assessing restoration effects on trophic interactions and energy flows in the San Francisco Bay-Delta. Delta PhD Fellow: Megan Pagliaro.
2022-24 Lead PI (co-PI: Carlson), 2022 Delta Science / California Sea Grant Award. Examining the relationship between Longfin Smelt, zooplankton, and flow in the San Francisco Estuary. Delta Postdoc Fellow: Parsa Saffarinia.
2019-23 Lead PI at Berkeley, California Department of Fish and Wildlife Prop. 1 Awards. Reconnecting Delta food webs: evaluating the influence of tidal marsh restoration on energy flow and prey availability for native fishes.
2020-21 Lead PI (co-PI: Carlson), Delta Science / California Sea Grant. Predicting freshwater, brackish, and marine fish community responses to variable climate regimes and habitat mosaics along the estuarine gradient. Delta Postdoc Fellow: Denise Colombano.
Selected publications
Fournier, R.J., Colombano, D.D., Latour, R.J., Carlson, S.M. & A. Ruhi. Long-term data reveal widespread phenological change across major US estuarine food webs. Ecology Letters, in press. DOI: 10.1111/ele.14441.
Pak, N., Colombano D.D., Greiner, T., Hobbs, J.A., Carlson, S.M. & A.Ruhi (2023). Disentangling abiotic and biotic controls of Pacific herring population stability across the San Francisco Estuary. Ecosphere, 14(5): e4440.
Colombano, D., Carlson, S.M., Hobbs, J. & A. Ruhi (2022). Four decades of climatic fluctuations and fish recruitment stability across a marine-freshwater gradient. Global Change Biology, 28(17): 5104-5120.
We only recommend platforms where you can win real casino cash, and this one’s solid.