SOD Blitz 2022 – Results Meeting Webinar Recording
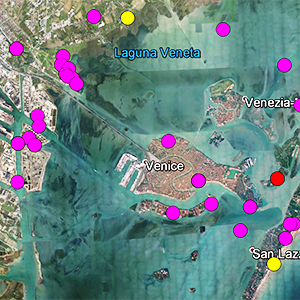
SOD Blitz Google Earth Map Overlay
 Need Google Earth? Download and install Google Earth here
2022 SOD Blitz Survey Highlights
Summary of 2022 SOD Blitz HighlightsSOD Blitz 2022 Results Table
| Location | Surveyed trees | Symptomatic oaks nearby? % | Sampled trees | SOD positive sampled trees % | Estimated true infection rate % | Symptomatic surveyed trees % |
|---|---|---|---|---|---|---|
| Big Sur | 43 | 8.3 | 24 | 45.8 | 44.8 | 97.6 |
| Carmel | 278 | 4.1 | 218 | 7.8 | 2.1 | 26.9 |
| Del Norte | 8 | 8 | 25 | 25 | 100 | |
| East Bay East | 619 | 12.7 | 236 | 3.3 | 1.3 | 36.9 |
| East Bay South | 10 | 0 | 13 | 7.6 | 7.7 | 100.0 |
| East Bay West | 558 | 17.6 | 102 | 10.7 | 4.4 | 41.2 |
| Humboldt | 74 | 0 | 21 | 0 | 0 | 18.9 |
| Lake | 0 | |||||
| Marin | 402 | 24.0 | 150 | 13.3 | 5.2 | 39.0 |
| Mendocino | 661 | 1.8 | 55 | 0 | 0 | 2.8 |
| Napa | 147 | 10.5 | 76 | 0 | 0 | 48.9 |
| Peninsula East | 216 | 28.8 | 45 | 4.4 | 1.3 | 28.2 |
| Peninsula North | 19 | 0 | 7 | 0 | 0 | 36.8 |
| Peninsula South | 481 | 39.2 | 56 | 1.7 | 0.9 | 51.1 |
| Peninsula West | 1472 | 28.0 | 346 | 8.9 | 5.9 | 66.0 |
| San Fancisco | 159 | 0 | 41 | 0 | 0 | 44.6 |
| San Luis Obispo | 451 | 0 | 77 | 0 | 0 | 12.4 |
| Santa Cruz | 250 | 10 | 40 | 0 | 0 | 28.4 |
| Siskiyou | 197 | 0 | 24 | 0 | 0 | 7.6 |
| Sonoma East | 309 | 6.8 | 131 | 18.3 | 10.5 | 57.3 |
| Sonoma North | 85 | 3.3 | 30 | 0 | 0 | 50.5 |
| Sonoma West | 257 | 8.5 | 105 | 1.9 | 0.5 | 24.9 |
| Trinity | ||||||
| Total | 6696 | 14.3 | 1805 | 7.1 | 3.1 | 43.8 |
Total number of 2022 SOD Blitz Participants = 258
Link to 2021 SOD Blitz Results
Link to 2020 SOD Blitz Results
Link to 2019 SOD Blitz Results
Link to 2018 SOD Blitz Results
Link to 2017 SOD Blitz Results
Link to 2016 SOD Blitz Results
Link to 2015 SOD Blitz Results
Link to 2014 SOD Blitz Results
Link to 2013 SOD Blitz Results
Link to 2012-2008 SOD Blitz Results
SOD Blitz 2022-2008 Results PDF
SOD Blitz 2022 results for web v1Back to SOD Blitz landing page
This activity possible thanks to funding from:
USDA Forest Service, State and Private Forestry
PG&E Foundation
National Science Foundation
MidPeninsula Regional Open Space District